a. As noted in Appendix E, the calculation of system energy and capacity values should be
undertaken only by individuals trained in hydroelectric benefit evaluation. One particular issue in
economic evaluation is the industry response to temporary versus permanent interruptions due to
the unsatisfactory performance on individual hydropower units. The question to be answered is
whether temporary losses in generating capacity will result in the electric generating industry
building permanent replacement capacity. If so, there is a "capacity loss avoidance benefit" from
major rehabilitation; if not, there is no capacity restoration as a source of benefit from
rehabilitation. The issue arises since the system contains some percentage of excess capacity to
compensate for unplanned outages. This issue is currently the subject of research. Until
procedures are established for calculating capacity losses due to unreliable performance, care
should be taken in including a capacity loss avoidance as a benefit from major rehabilitation. For
the purposes of this example, Table F-2 shows the assumed opportunity costs of unsatisfactory
performance.
Table F-2: Energy and Capacity Opportunity Costs
b. At any point in time, either or
both of the components of each unit could
perform unsatisfactorily or satisfactorily.
Units Down
Opportunity
The probability of the first occurrence of
Cost per Year
unsatisfactory performance for a
component is dependent on the initial risk,
0
0
the degradation in reliability (increase in
risk), and the number periods since the
1
300,000
beginning of the analysis. Following this
initial event for each component, the
2
10,000,000
probability of unsatisfactory performance
for the component is dependent on the risk
of the repaired component, the
degradation in reliability and the number
of periods since the last episode of
unsatisfactory performance.
c. If the turbine or generator performs satisfactorily, deterioration or degradation occurs
and is represented by the annual rate of change in the risk. This degradation rate may be a
constant added to the risk each year the component doesn't fail. The level of risk over the life-
cycle could be a linear or nonlinear function of time.
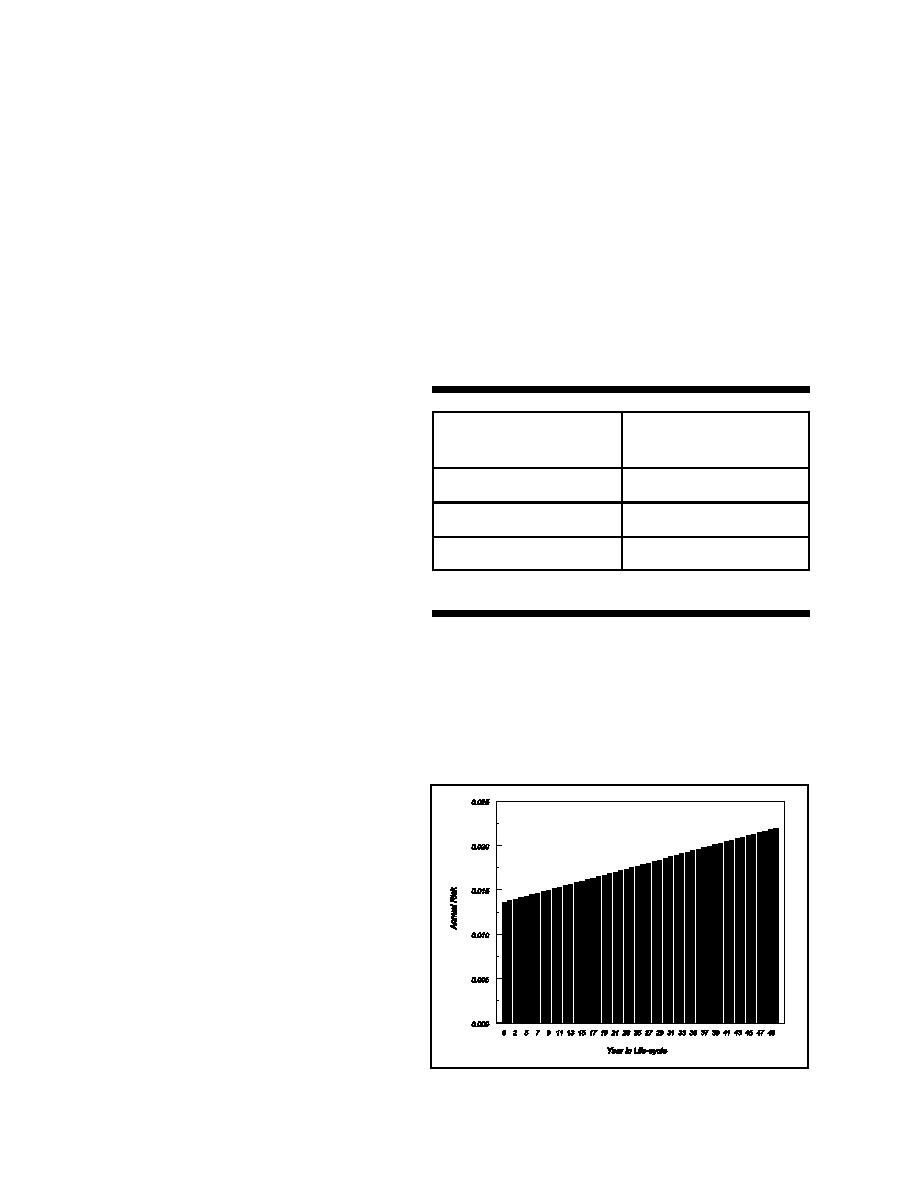
d. Figure F-1 shows the level of
risk over the life-cycle of a component
assuming a linear degradation pattern.
Figure F-2 shows the level of risk for the
same component assuming a nonlinear
degradation. There are more than 1.1259
x 1015 (250) possible risk based life-cycles
for a single component.
e. At the end of each period, the
unit is either in service, or is out of service
due to the failure of one or both of the
components. The number of units out
simultaneously is important in terms of the
cost of energy losses and possibly system
capacity losses. These losses are generally
increasing functions of the number of
Figure F-1: Linear Risk Function
F-2


 Previous Page
