EP 1130-2-500
27 Dec 96
some risk-based criteria. This comparison might result in an initiation of a rehabilitation study but
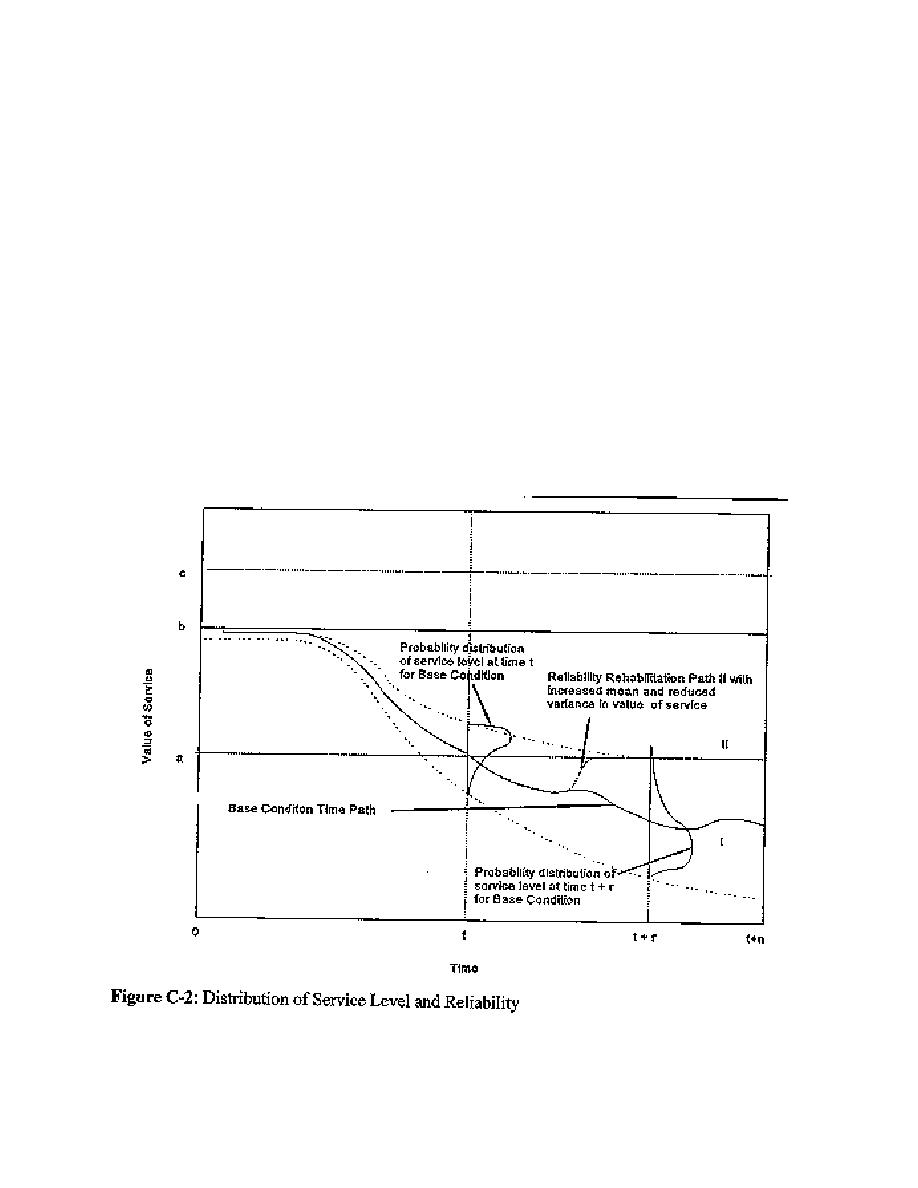
would not be sufficient to recommend any rehabilitation. The distribution of services shifts from
being positively skewed to negatively skewed so that the frequency of lower service levels
increases over time. Service level a could still be produced under ideal circumstances, e.g. no
break-downs, balky equipment functions properly, etc., but the likelihood of level a declines.
Thus, the Base Condition shows a reduced level of reliability but does keep the project producing
some services.
a. The dashed line in Figure C-2, labeled II, shows that the rehabilitation shifts the yearly
distribution of project services, increasing the mean and reducing the variance (not shown).
Notice, however, that the rehabilitation does not increase the "potential" service flow from the
Base Condition since under ideal circumstances the Base Condition could still produce level a.
b. In fact, any rehabilitation that results in a time path between II and III in Figure 1
could be described as Reliability rehabilitation. Note also that reliability rehabilitation might
consider a scheduled future, rather than an immediate, rehabilitation. The time path for this
alternative would follow Path I until some point after time t then trace a path such as shown by II
in Figure C-1. Thus, rehabilitation planning should consider the appropriate timing for
implementation as well as an expected value of service less than provided by level b and more
than provided by level a.
C-3


 Previous Page
