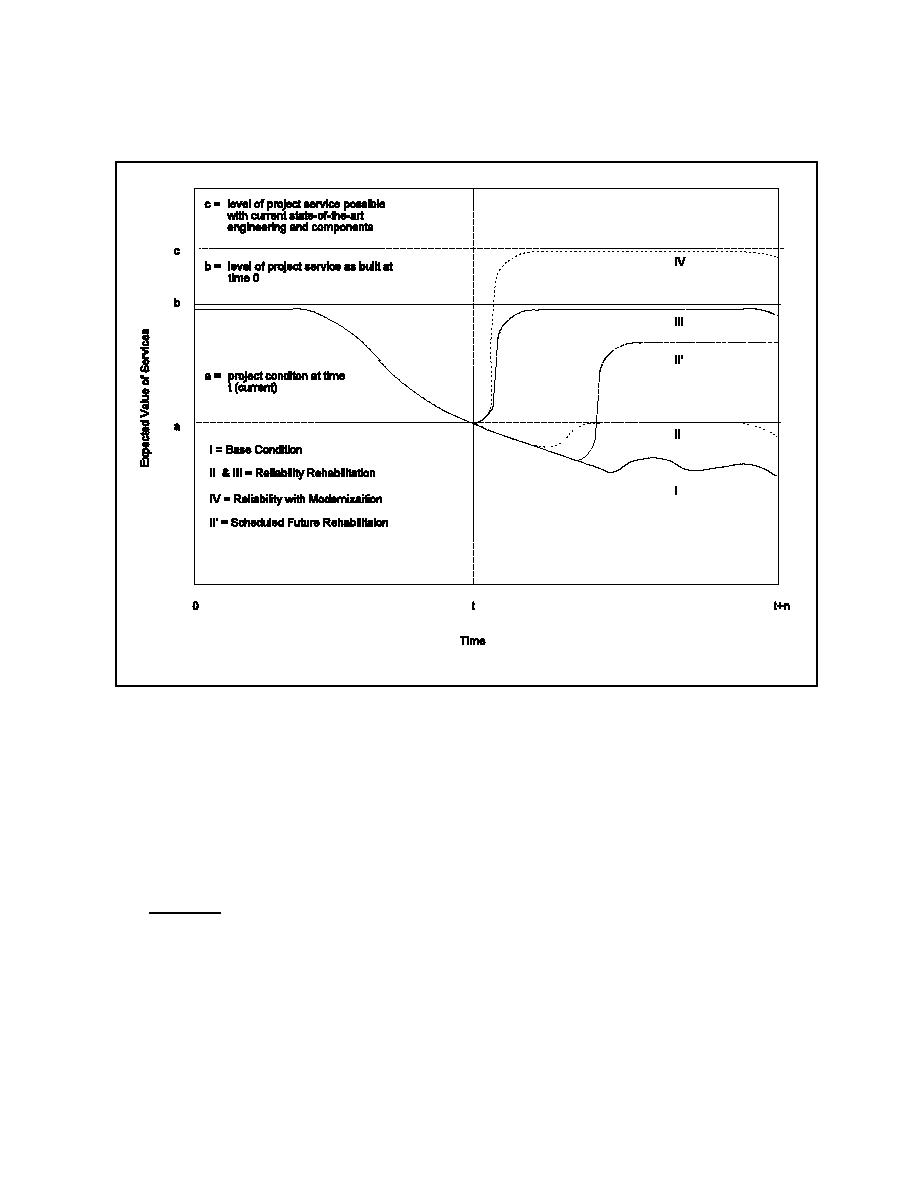
Figure C-1: Expected Value of Service Flows and Rehabilitation
a. Path III shows a different rehabilitation alternative that restores the expected service
level to the original condition, shown by line b, realized when the project was built. This may be
described as a full, in-kind replacement of the project feature or features.
b. Path IV shows a rehabilitation alternative that clearly "upgrades" the project in relation
to the original condition denoted by line b. Thus, the service flows and reliability are improved
compared to the Base Condition. This rehabilitation would be Reliability with Efficiency
Improvements.
C-4. Reliability. Figure C-2 shows a clearer representation of a reliability rehabilitation. The
figure represents the 3-dimensional aspects of service level, time, and probability in 2-
dimensions. The vertical axis measures the actual service flow. The figure shows that for Path I,
the Base Condition, the expected value of service level declines and the variance increases. At
time t the reliability of service that triggers a rehabilitation study could be displayed in Figure C-2
by comparing the area under the probability distribution with service flow less than a with
C-2


 Previous Page
