EP 1110-2-12
30 Sep 95
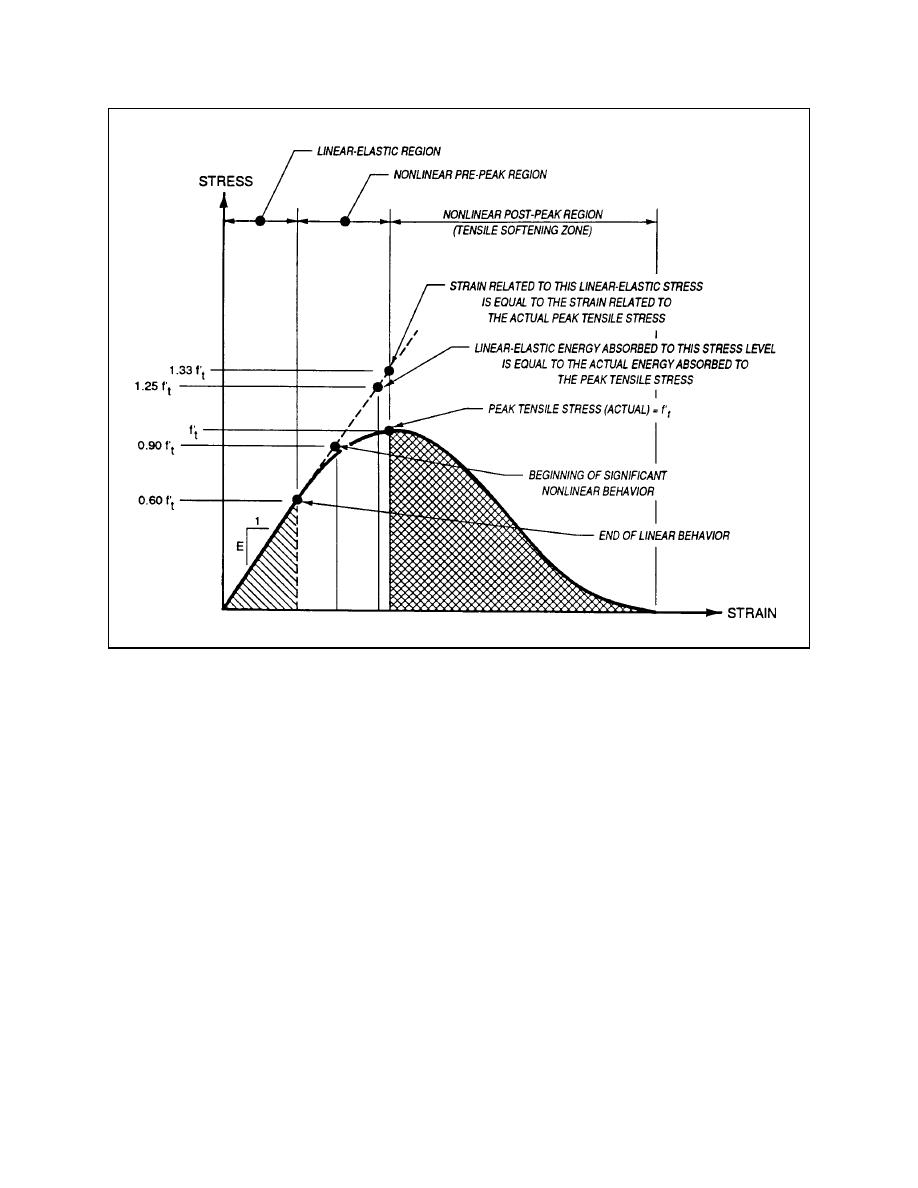
Figure 3-7. Tensile stress/strain diagram for RCC
this point, the response can still be judged as primar-
b. Key points on stress/strain curve. Several
ily linear.
points on the stress/strain curve are of interest when
establishing the allowable tensile stresses that are
(3) ft = 1.25 f ′t -- the area under the dashed line
used in linear-elastic analyses (refer to para-
graphs 4-2c and 4-3c). Based on f ′t = actual peak
for linear-elastic behavior up to this stress level is
approximately equal to the area under the solid line
tensile stress (tensile stress that corresponds to that
for the actual stress/strain curve up to the peak tensile
which would be attained by a direct tensile strength
stress point (this point is the end of microcracking
test), and ft = the stress level based on linear-elastic
and the beginning of macrocracking). Thus, the
behavior (refer to the dashed line in Figure 3-7), the
energy absorbed in a linear-elastic analysis to this
following key values of ft are of interest:
point of stress is equal to the actual energy absorbed
(1) ft = 0.60 f ′t -- the end of the elastic range
through the microcracking pre-peak region.
and the beginning of microcracking.
(4) ft = 1.33 f ′t -- the strain corresponding to this
(2) ft = 0.90 f ′t -- this point was selected because
point of stress based on linear-elastic behavior is
equal to the strain corresponding to the actual peak
the stress/strain dashed line for linear-elastic behavior
tensile stress. This strain point signifies the end of
is just beginning to significantly separate from the
microcracking and the beginning of macrocracking.
actual stress/strain curve. If the tensile stresses for a
This point also represents a practical limit for the
linear-elastic analysis stay within the stress level for
3-8


 Previous Page
