EP 1110-2-12
30 Sep 95
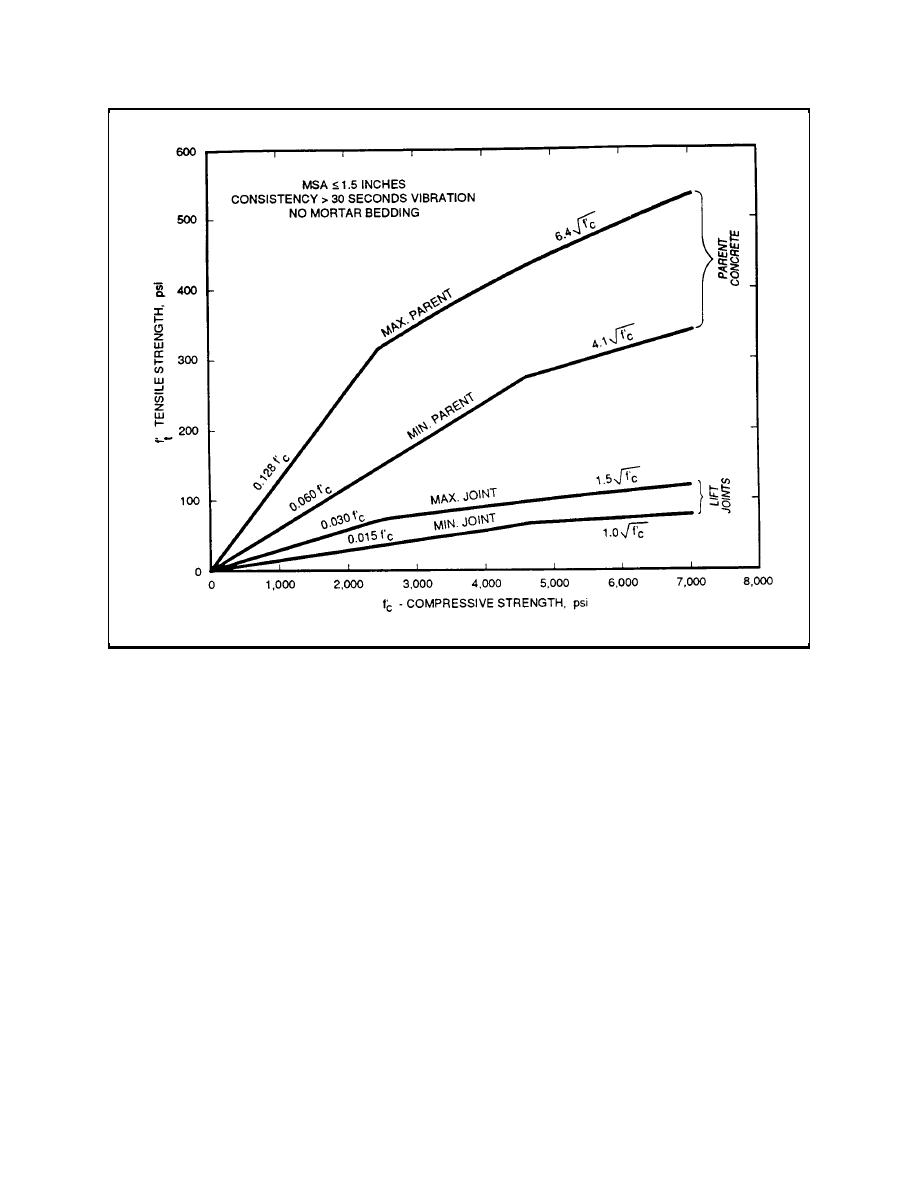
Figure 3-5. Tensile strength range, RCC, MSA ≤ 1.5 inches, consistency > 30 seconds vibration, no mortar
bedding
3-8.
Dynamic Tensile Strength (DTS)
stress. The last region is termed the "tensile soften-
ing zone." In this region, where deformation
The tensile strength of concrete is strain rate sensi-
increases with decreasing stress, deformation con-
tive. During seismic events strain rates are related to
trolled stable test procedures are required to capture
the fundamental period of vibration of the dam with
the stress/strain behavior (Bruhwieler 1990), where
the peak stress reached during a quarter cycle of
conventional test procedures will cause the strain to
vibration. The high strain rates associated with dam
fall off abruptly to zero strain at a point on the curve
response to ground motion produce tensile strengths
just beyond the peak stress point. The area under the
50 to 80 percent higher than those produced during
tensile softening region of the stress/strain curve
direct tensile strength testing where the strain rate is
represents additional energy absorbed by the RCC
very slow. For this reason, the dynamic tensile
structure during the crack formation process. As
strength (DTS) of RCC shall be equivalent to the
such, this region is quite instrumental in dissipating
the energy imparted to the dam through seismic
direct tensile strength multiplied by a factor of 1.50
ground motion. The transition from linear to nonlin-
(Cannon 1991, Raphael 1984). This adjustment fac-
ear in the ascending region of the stress/strain curve
tor applies to both the tensile strength of the parent
represents the development of microcracking within
material and to the tensile strength at the lift joints.
the concrete. These microcracks eventually coalesce
into macrocracks as the tensile softening zone is
reached.
3-6


 Previous Page
