EP 1110-2-12
30 Sep 95
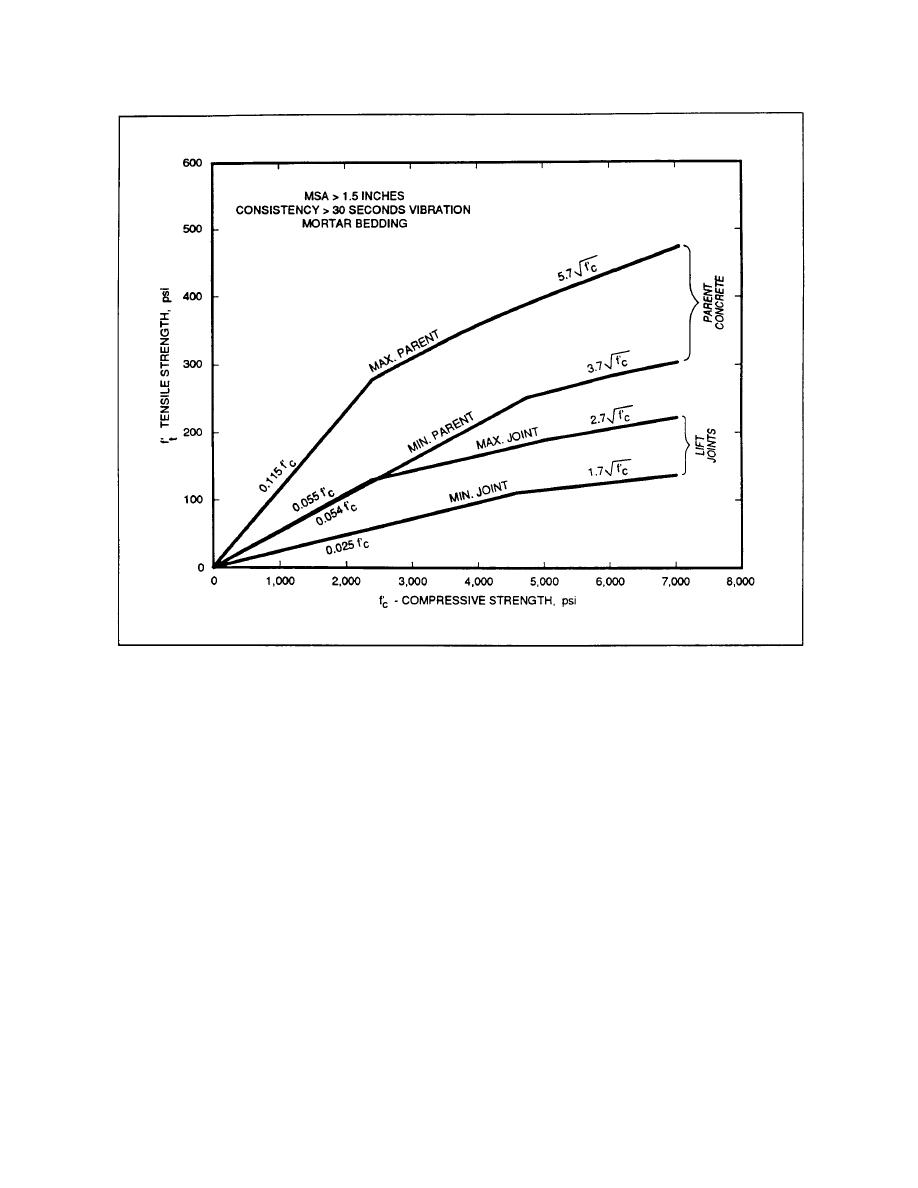
Figure 3-4. Tensile strength range, RCC, MSA > 1.5 inches, consistency > 30 seconds vibration, mortar
bedding
3-7.
Tensile Stress/Strain Relationship
respect to the peak stress or ultimate capacity. In
tension, it is a different matter since tensile stress can
approach and exceed the peak tensile stress capacity
As mentioned in paragraph 2-2b, concrete cracking,
of the concrete and in some cases cracking will
crack propagation, and the energy dissipated in the
occur.
process are complex and nonlinear in nature. For a
simplified linear-elastic analysis, a constant modulus
b. Tensile stress/strain curve. The actual non-
of elasticity is required. Thus, a linear stress/strain
relationship is used for the analysis with a tensile
linear stress/strain relationship for RCC concrete is
modulus equal to the modulus of elasticity for con-
shown in Figure 3-7. The assumed linear relationship
crete in compression.
used for finite element analysis was developed from
the work done by Raphael (1984). The actual nonlin-
ear performance of concrete in tension consists of a
a. Compression and tension differences.
linear region from zero stress up to 60 percent of the
Although a linear relationship is assumed for the
peak stress, a nonlinear ascending region from
analysis, in actuality the stress/strain relationship
60 percent of peak stress to peak stress (this point on
becomes nonlinear after concrete stresses reach
the curve corresponds to the direct tensile strength
approximately 60 percent of the peak stress (Raphael
test value described in paragraph 3-3c), and a nonlin-
1984). In compression this does not cause a problem
ear descending region from peak stress back to zero
because, in general, concrete compressive stresses
even during a major earthquake are quite low with
3-5


 Previous Page
